Crowdsourced Urban Heat Maps Reshape Opinions and Landscapes
A Companion Blog to the Internet of Nature Podcast Season 5, Episode 4
September 5, 2023 | Alec Sabatini

If you can’t stand the heat, you’re not alone.
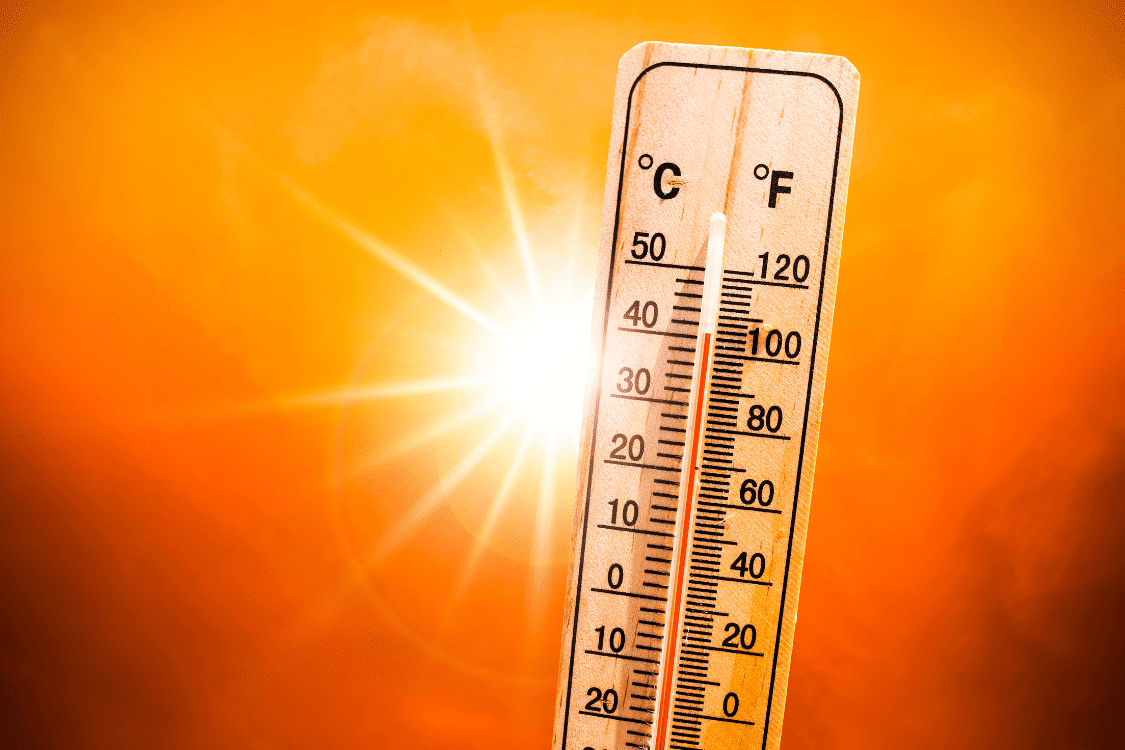
Climate change and the urban heat island effect are sending city thermometers soaring, particularly in low-income and nonwhite neighborhoods. Many recognize urban trees are a key defense against heat, but getting the space and resources to plant and maintain greenspace takes substantial political and financial will, especially when competing against priorities like development or transportation.
Community-led heat mapping is helping to tip those scales by activating community members with data that backs up their lived experiences. To talk about these efforts and the intersection of heat and greenspace, Dr. Nadina Galle hosted Vivek Shandas, Professor of Climate Adaptation at Portland State University on Episode 5 of her podcast.
Community-Led Heat Mapping
Most cities have less than a dozen active temperature and air quality sensors. Tens of square kilometers and thousands of people have to rely on a sensor or two to learn about their air. For a culture so reliant on analytics, American cities rarely have enough information to make evidence-based decisions.
How do we change that? In 2018, the climate firm CAPA Strategies, of which Professor Shandas is a senior advisor, created the Heat Watch program to start bridging that information gap. Here’s how it works:
- After a community reaches out, CAPA Strategies provides training and materials to local champions for context on the importance of heat mapping
- On a designated hot day, CAPA Strategies provides low-cost, research-grade sensors to community volunteers who attach them to their cars, bikes, or backpacks
- Volunteers follow pre-mapped transects through their city, collecting temperature and humidity data along the way
- The routes are driven/biked/walked once in the morning, afternoon, and evening
In one fell swoop, volunteers collect hundreds of thousands of geo-located data points. The end product is a high-resolution data set of air temperature and humidity, and a report by CAPA Strategies with a detailed analysis of the distribution of heat throughout the community.
“The resolution of data has been revolutionary for the work we are doing. It helps us understand what an individual is experiencing. What is the air under their nose like? What is the temperature on the skin?”
– Vivek Shandas
This hyper-local data helps city staff and community members see their neighborhoods differently. With a clear picture of how heat is concentrated in certain areas, the question then becomes, what can they DO about it? How can they redesign infrastructure to make greenspace more present in their lives? Where can more space be made for trees?
“It has been an overwhelmingly compelling experience for me to see how little bits of granular data and a systematic process can get folks really charged and activated to bring more greenspace into cities,” said Vivek. These campaigns provide scientific backing to people’s lived experiences. It’s what has made the Heat Watch campaigns so powerful. It’s not an outside organization making maps for residents. The citizens living in these heat islands get to create their own evidence base and then use that to advocate for change.

Heat Mapping Impacts
The data and reports from Heat Watch campaigns have informed city sustainability plans, public health practices, urban forestry efforts, research projects, and other engagement activities. As an example, Vivek shared the story of a heat mapping campaign in Yonkers, New York.
CAPA Strategies provided high school volunteers with FLIR thermal cameras that attached to their phones and tasked students with taking pictures of the hottest and coolest places they could find. It became clear some neighborhoods had less shade, fewer trees, and much higher temperatures than others.
With photos and data in hand, volunteers demonstrated the inequitable shade and heat across their neighborhoods to the city council. They also showed how this imbalance had grown out of historic redlining practices. In the face of passionate advocacy and empirical reports, the city council eventually agreed to commit tens of millions towards planning and implementation of additional greenspace in hotter neighborhoods.
This is one story in a growing trend. Urban heat is becoming one of the most effective catalysts for urban forestry initiatives. An uncomfortably hot neighborhood is visceral, and so is the relief offered by greenspace. Connecting the real experience of the people with data is a potent combination for change.
Thanks for plugging into the Internet of Nature today. You can find links to all of the episodes and blogs from Season 5 here.

0 Comments
Recommended Comments
There are no comments to display.
Create an account or sign in to comment
You need to be a member in order to leave a comment
Create an account
Sign up for a new account in our community. It's easy!
Register a new accountSign in
Already have an account? Sign in here.
Sign In Now